
Fresh out of college, you may surely feel discouraged seeing job postings for data analyst roles demanding at least “3+ years of experience”. But not having the perfect plan to map up the years of experience is not why this field is daunting.
Tons of analyst wannabes end up wasting time on bouts of self-imposed random skills development. Employers really don’t care if you’ve mastered every single function in Excel. They care if you can navigate and develop a project from messy data and ultimately make decisions that are of value to the business. This roadmap offers a structured, realistic 6-month plan to guide you from being a total newbie analyst to having a valuable portfolio.
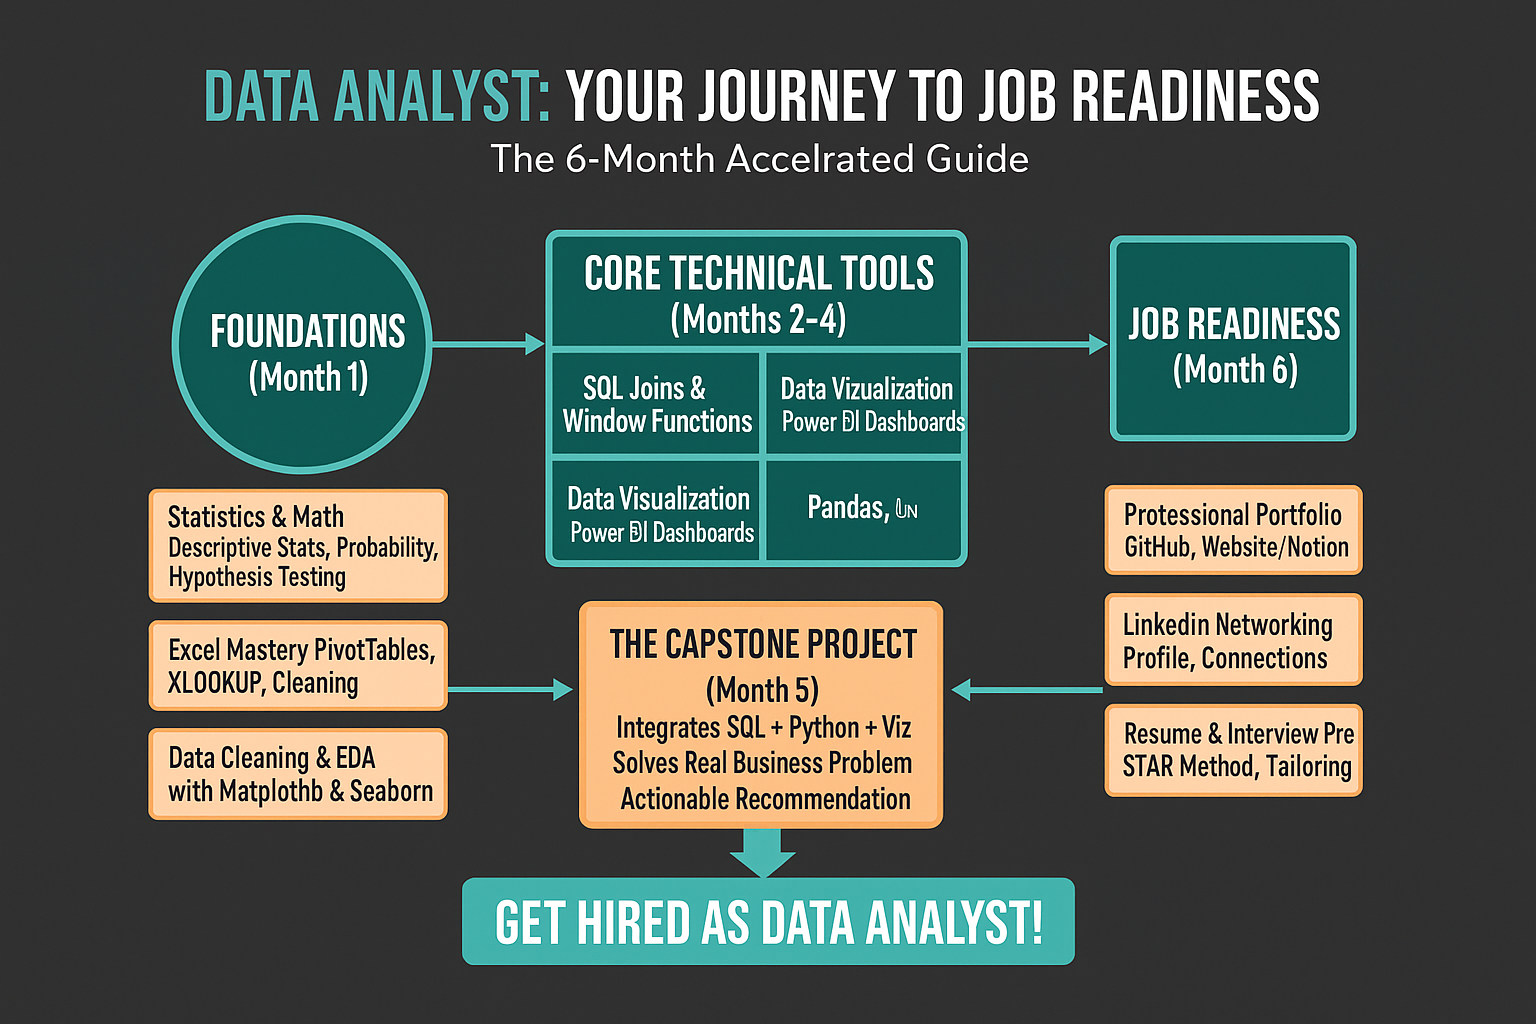
This 6-month data analyst roadmap moves through five sequential phases: Excel and analyst thinking (weeks 1-3), SQL (weeks 4-7), data visualisation with Tableau or Power BI (weeks 8-11), Python (weeks 12-16), and a capstone project (weeks 17-20), followed by interview preparation from week 21 onward. Each phase builds directly on the last, so skipping ahead usually costs you time later.
The best analysts are problem solvers that use data. The first three weeks of the course are about the mental model you will use to build and analyze a business. You will not be required to memorize formulas.
Core skills to master in this phase:
- Excel formulas like VLOOKUP, INDEX-MATCH combinations, and pivot tables.
- Data cleaning functions, including TRIM and conditional IF statements.
- Summarising raw data into insights someone can act on.
Start with Excel. It sounds basic, but it is still the workhorse tool in most businesses, and mastering it teaches you how to think about data structure. Do not skip the unglamorous parts, real-world data is never clean.
MilestoneTake a genuinely messy dataset, clean it completely, then use pivot tables to extract three meaningful insights. Write a one-page summary someone’s manager could read in 90 seconds.
Action step: download a messy public dataset from Kaggle or data.gov. Spend a weekend cleaning it until it is spotless, then build your summary report.
Querying a database directly requires SQL. Every business that uses a database will need someone with basic knowledge of SQL. This language will provide you with a job in this industry.
Skip the tutorials that only teach SELECT and FROM. You need:
- All JOIN types: INNER, LEFT, RIGHT, and FULL joins.
- Advanced filtering: CASE statements for conditional logic.
- Efficient querying: subqueries and CTEs (Common Table Expressions).
These are not advanced concepts, they are standard tools you will use daily.
MilestoneWrite a query that pulls data from 3 to 4 different tables, performs a calculation such as total revenue by region, and filters down to answer a specific business question. If you can do that confidently, you are ahead of half the candidates applying to entry-level roles.
Action step: work through SQL problems on LeetCode or Mode Analytics, then start a real project, for example analysing an e-commerce database to find which product categories drive the most repeat purchases.
This is where most analysts fail. You can have the perfect dataset and brilliant insights, but if you cannot communicate them visually, they die in your Excel file.
Pick either Tableau or Power BI, both are industry standards, choose based on what is popular at your target companies. Focus on:
- Connecting to various data sources, SQL databases and CSV files.
- Creating calculated fields for custom metrics.
- Designing dashboards using the Data-Ink Ratio and Gestalt principles.
The rule to live by: if a stakeholder cannot grasp your main point in under 30 seconds, the visualisation failed. Use clear, action-oriented titles and highlight the one metric that actually matters.
MilestoneBuild an interactive dashboard with a clear narrative flow. A strong dashboard makes its main insight obvious through a clear title and one spotlighted metric, not five competing charts.
Action step: find a public dataset you care about, COVID trends, climate data, or local crime statistics, and build a dashboard with a clear story. Practice presenting it out loud. If you stumble explaining it, redesign it.
SQL extracts data, BI tools present data, and Python helps with everything else. Most of your more complex data cleaning, reorganizing, and analysis all falls on Python.
Your Python essentials:
- Setup: get comfortable with Jupyter Notebooks for interactive analysis.
- Pandas: master DataFrames, groupby, merge, and concat operations.
- NumPy: learn numerical operations for efficient calculations.
- Visualisation: build basic plots with Matplotlib or Seaborn.
Do not try to become a machine learning expert in this phase, that is a different career path entirely.
MilestoneImport a messy CSV, clean it thoroughly in Pandas (missing values, duplicates, wrong data types), then run exploratory data analysis to uncover initial patterns.
Action step: grab a Kaggle dataset and run a complete cleaning and EDA project. Focus on the process, how you handled problems, what you discovered, and what questions came up.
Hiring managers value proof over tutorials. Your capstone shows the entire process of analysis from pulling data with SQL to cleaning and analysis with Python, finally ending with presentation of analysis through visualization.
This cannot be a textbook exercise. Define a real business problem. Your project must show:
- A genuine business scenario: customer churn, inventory optimisation, or employee turnover.
- Your own methodology, how you approached the problem differently.
- Actionable recommendations, specific steps a business could actually take based on your findings.
This project proves you have done the work and understand business impact, not just technical execution. It is what separates candidates who only completed tutorials from candidates who can actually deliver.
MilestonePublish the project in a professional GitHub repository. Your README needs the business problem, your methodology and tools, your key findings, and your final business recommendation, the recommendation matters most.
Action step: make the README clear enough that someone could implement your suggestion without asking a single follow-up question.
You have built the skills. Now you have to sell them. This final phase is about communication and confidence, not new technical material.
Your interview prep checklist:
- Master the STAR method for behavioural questions (Situation, Task, Action, Result).
- Practice SQL live coding on platforms like HackerRank or LeetCode.
- Rehearse your project presentation until it sounds conversational, not scripted.
- Network actively on LinkedIn and attend data meetups in your area.
When explaining your capstone in interviews, avoid clunky, overly formal phrasing. Start with your recommendation first, then walk backwards through how you got there. That order shows you think like a business person, not just an analyst.
GoalWalk into every interview ready to explain not just what you built, but why it matters and what business impact it could have.
Action step: run mock interviews with a friend, a mentor, or an online platform. Practice explaining your capstone conversationally, without sounding rehearsed, then start applying aggressively to analyst roles.
Why does this sequence actually work?
Most roadmaps put tons of skills on a list and hope you pick something. This roadmap is sequential, and each phase builds on the one before it. By phase five, you provide a project that shows real value to your business.
This isn’t analysis paralysis. This roadmap teaches you the skills you need to land a job, and potential employers appreciate. Other students are still on the fence about which course they should take, you will be applying to real jobs with a completed project behind you.
How do I apply with no work experience?
You must create your own proof. Consider your capstone as your experience. Your GitHub repo as your resume. Be able to explain your analysis to a non-technical audience. Why be able to explain your analysis? Because Excel foundation, being able to write basic SQL queries, being able to create visualizations with Tableau and Power BI, and having the ability to do certain tasks with Python combine to provide an immediate advantage to your employers. This is a collection of skills that you can use with immediate effect.
If you want mentorship and real-world projects built around this same sequence, ISMT Business School runs data analytics courses designed specifically for freshers, combining this learning path with industry connections and placement support. Details are on the contact page.
Written by Devesh Tatkare, SEO Executive, Last updated August 29, 2026.